Summer
Long days, vibrant festivals and endless outdoor adventures.
Access your favourites here
You have a trip stored, would you like to save it?
The warmest months are December, January, February and March. Autumn has still, sunny days. Winter runs from May through August. However, being positioned by the Southern Ocean, the world's weather engine, the climate can vary greatly – on any given day.
Average maximum temperatures in summer sit between 18 and 25 degrees Celsius. Hot days over 30 degrees are not uncommon. Winter maximum temperatures are between 3 and 11 degrees.
Rainfall varies dramatically across the island. Hobart, with an annual average of 569mm, is Australia's second-driest capital city (after Adelaide), while on the west coast an annual average of 2400mm ensures the rainforest thrives.
Be prepared for sudden changes in the weather, especially if bushwalking in parks and reserves. Always carry extra warm clothing, including a waterproof outer layer. And while 23 degrees might not sound particularly warm in summer, it’s a dry heat and the sun can be hot. UV from the sun's rays is high from September to April, so sunscreen and a hat are essential during these months.
It’s important to check weather forecasts and warnings and stay up to date on bushfire, flood and emergency alerts, especially before heading into the wilderness. Bushfire risk is higher in summer months – have an emergency plan, include refuge areas in your planning and seek shelter if you’re caught on foot. Before you visit a national park in Tasmania, make sure you read this essential information, and brush up on these bushfire safety tips.
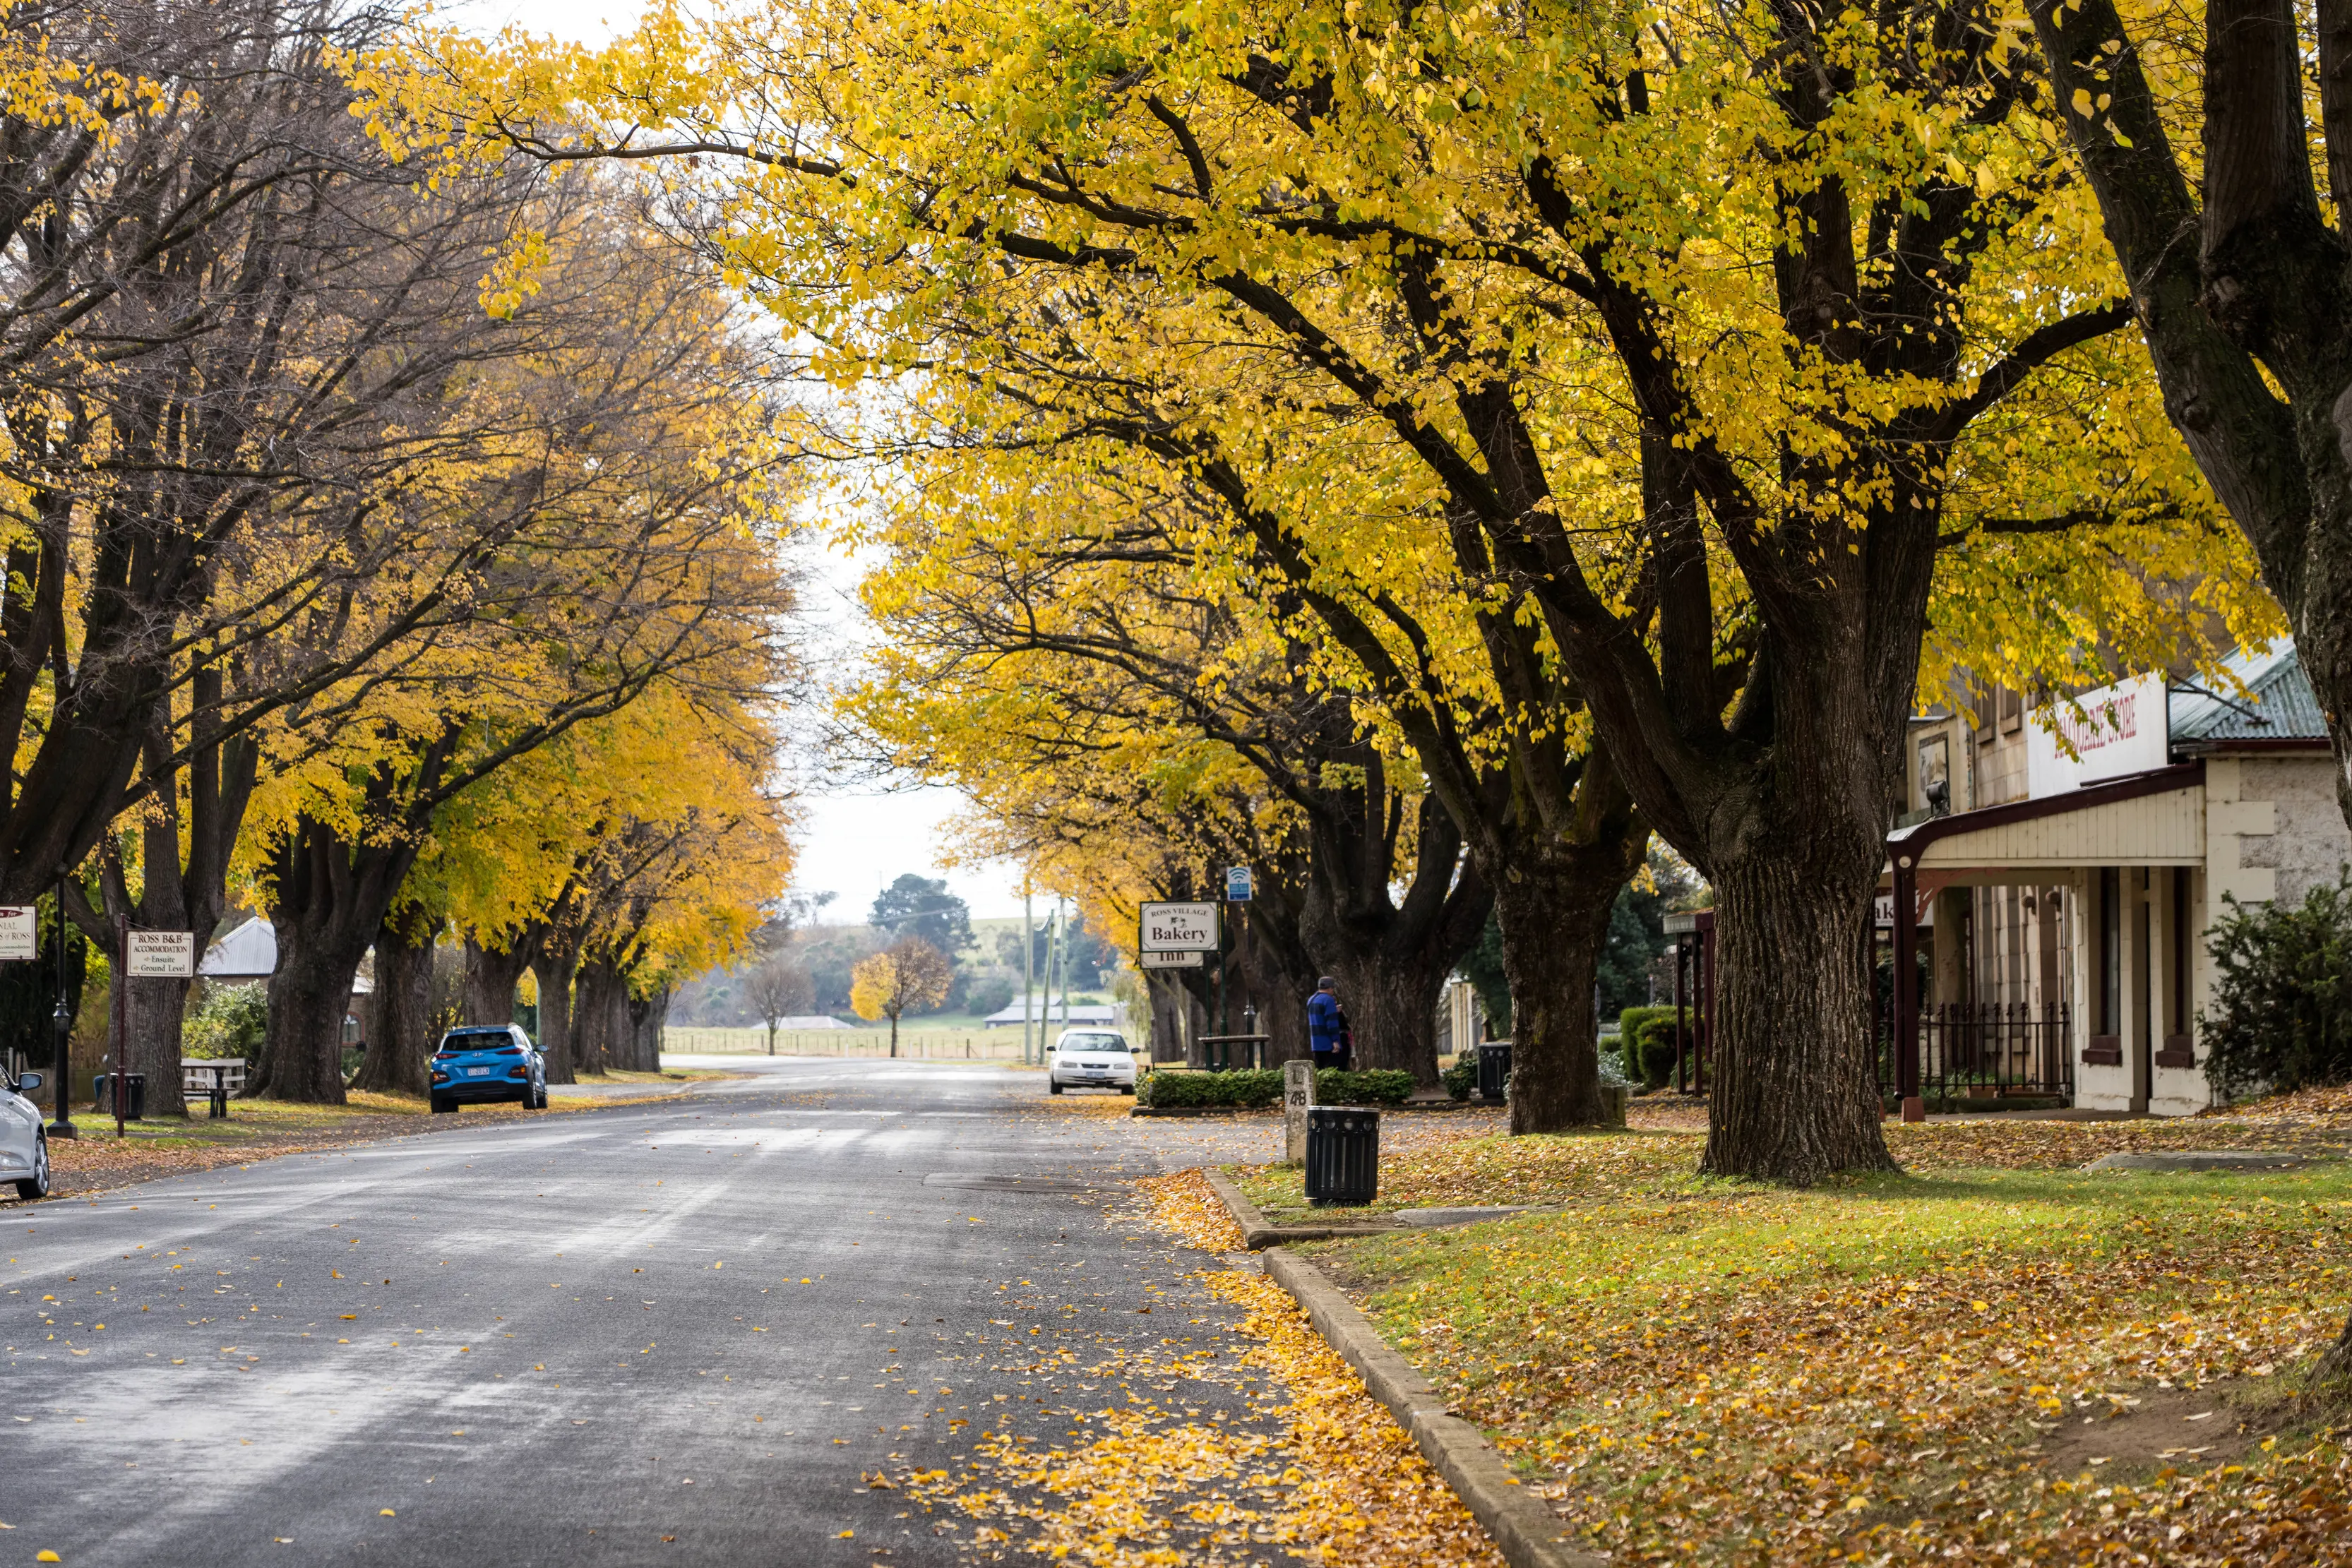
Church Street, Ross
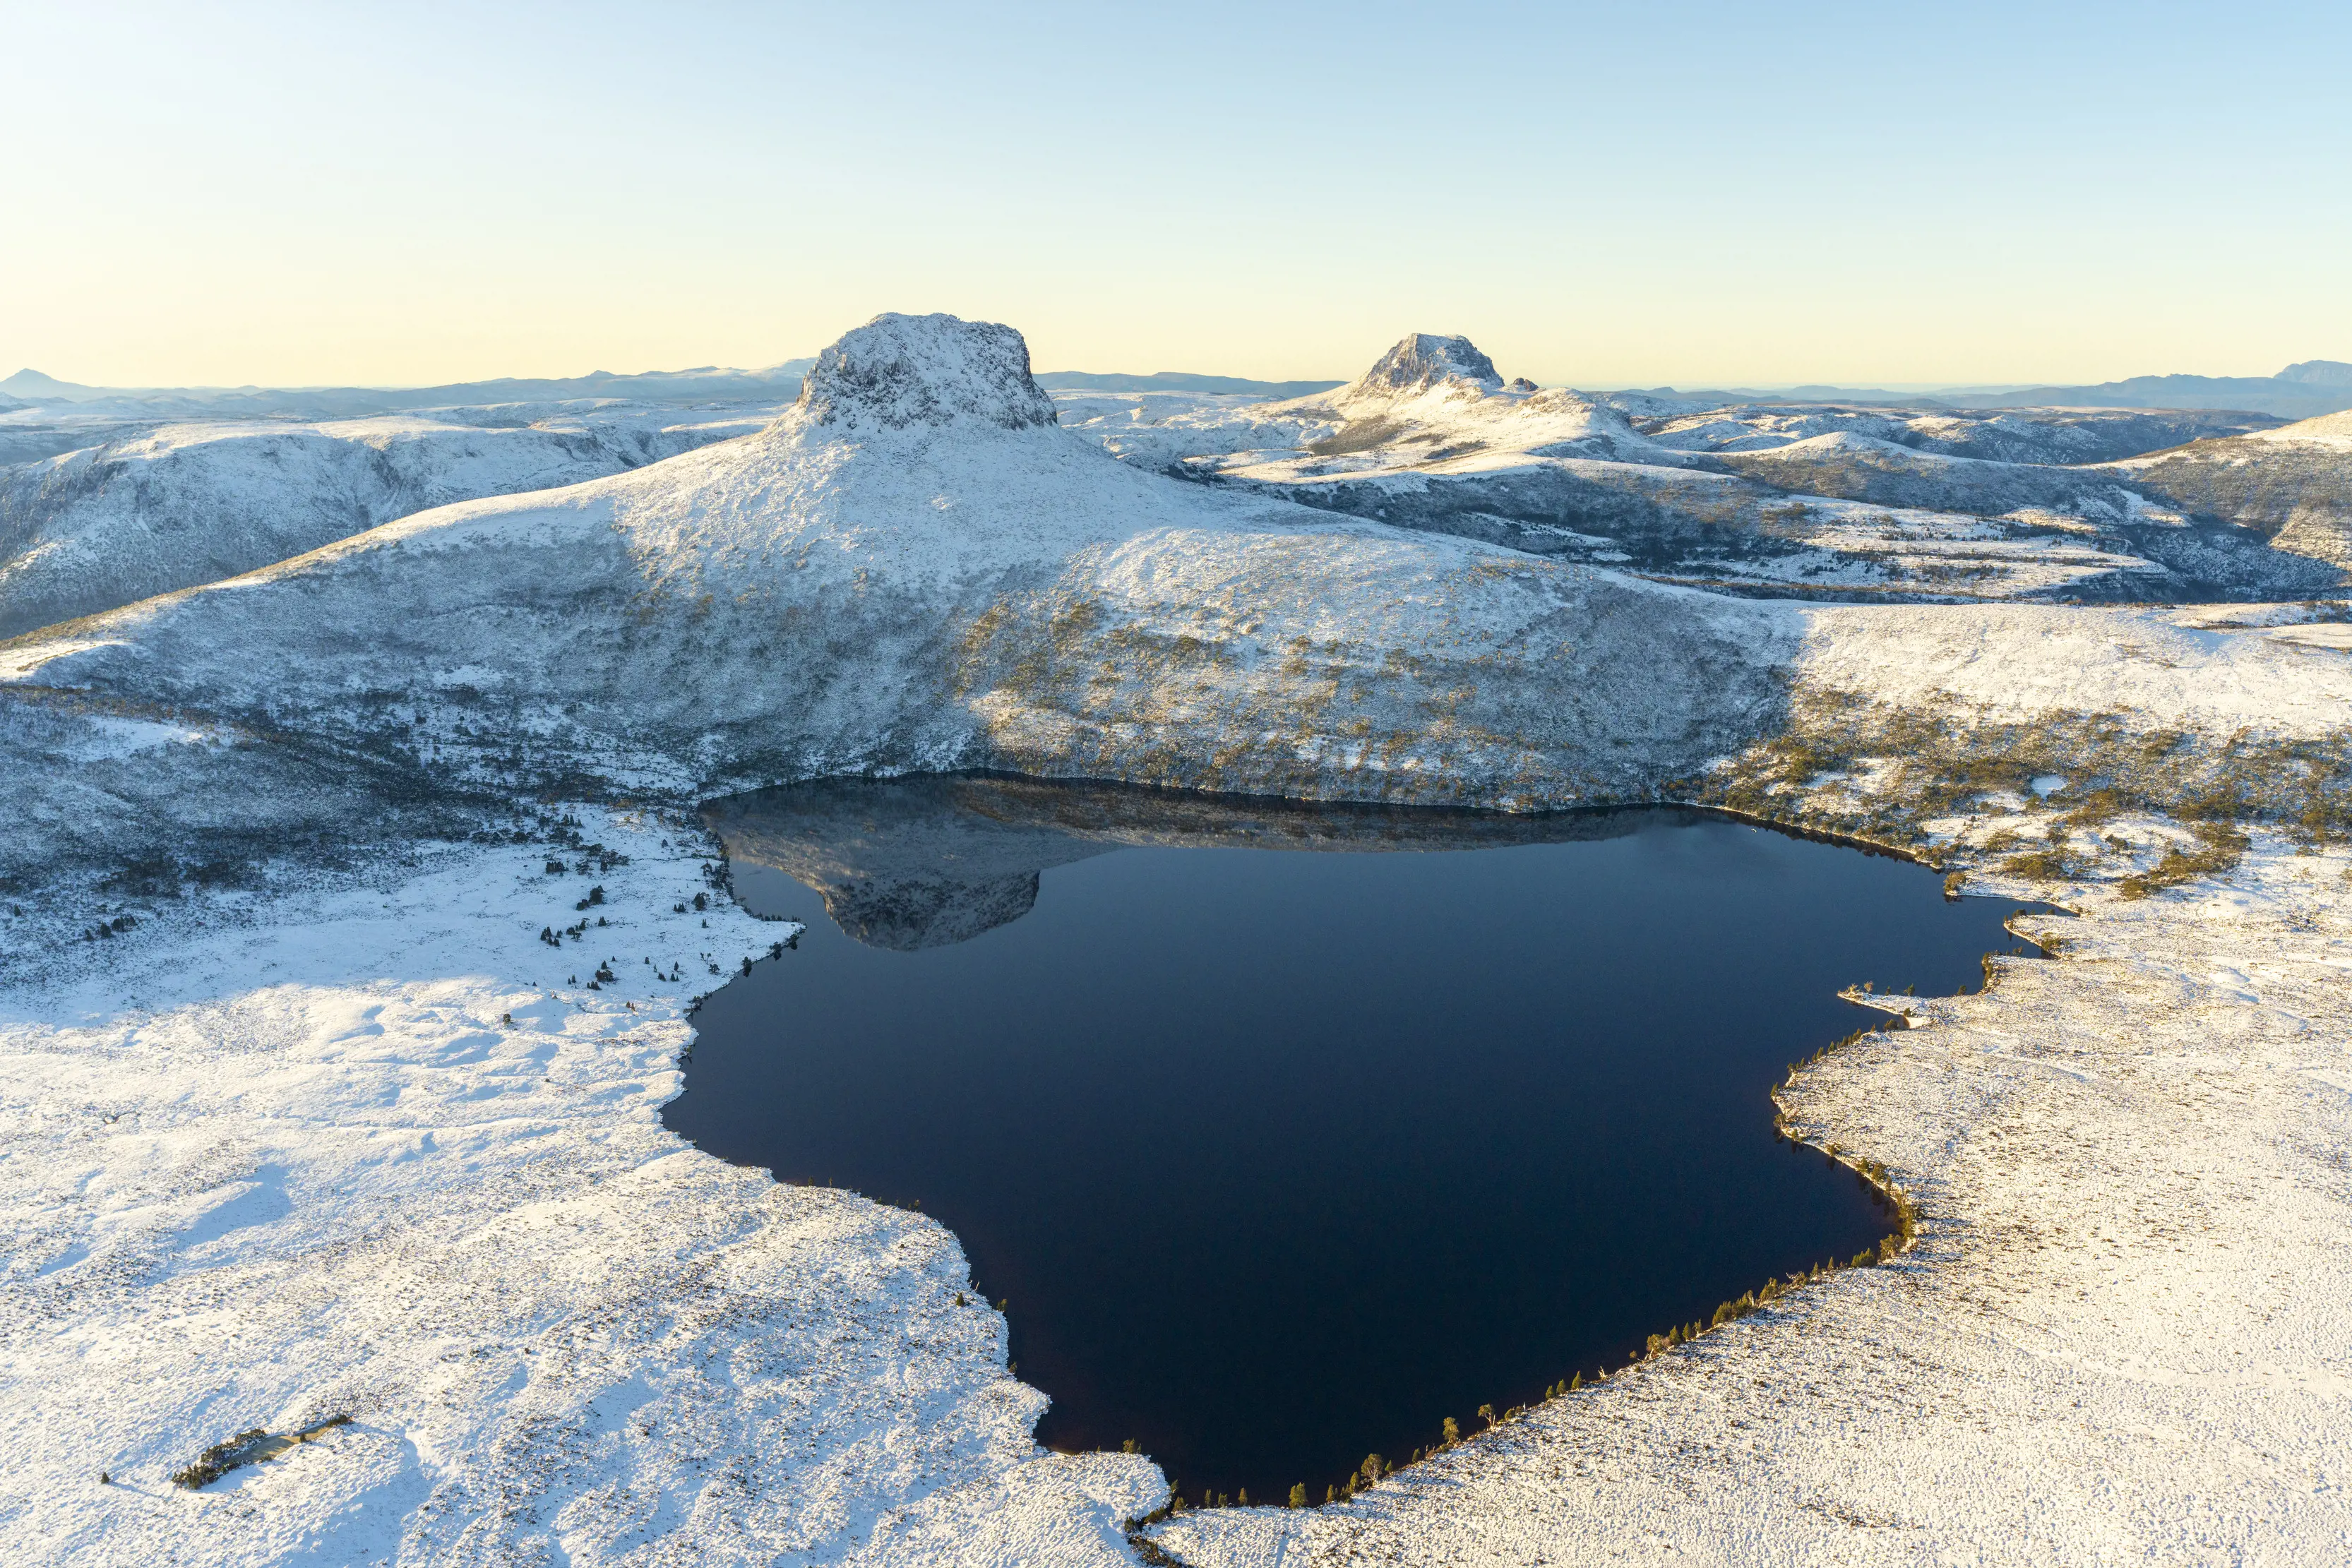
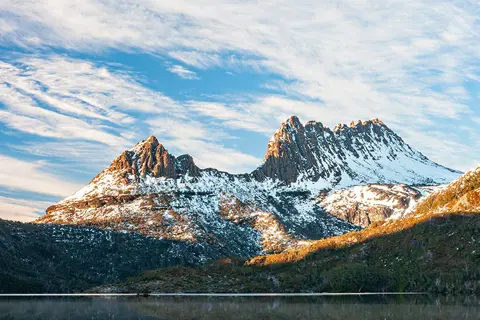
Barn Bluff and Lake Will, Cradle Mountain-Lake St Clair National Park
To help with planning, here are the average monthly minimum and maximum temperatures (in degrees Celsius) around the island.
Month |
Avg. minimum temp. (C°) |
Avg. maximum temp. (C°) |
| January | 13 | 23 |
| February | 13 | 22 |
| March | 12 | 23 |
| April | 10 | 19 |
| May | 7 | 17 |
| June | 6 | 13 |
| July | 5 | 13 |
| August | 5 | 15 |
| September | 7 | 15 |
| October | 8 | 18 |
| November | 10 | 20 |
| December | 12 | 22 |
Month |
Avg. minimum temp. (C°) |
Avg. maximum temp. (C°) |
| January | 13 | 25 |
| February | 12 | 26 |
| March | 12 | 24 |
| April | 9 | 21 |
| May | 5 | 17 |
| June | 3 | 13 |
| July | 2 | 13 |
| August | 4 | 15 |
| September | 7 | 15 |
| October | 8 | 19 |
| November | 9 | 21 |
| December | 12 | 23 |
Month |
Avg. minimum temp. (C°) |
Avg. maximum temp. (C°) |
| January | 12 | 22 |
| February | 13 | 23 |
| March | 12 | 24 |
| April | 9 | 19 |
| May | 6 | 16 |
| June | 4 | 13 |
| July | 4 | 13 |
| August | 5 | 14 |
| September | 6 | 15 |
| October | 8 | 17 |
| November | 11 | 19 |
| December | 12 | 20 |
Month |
Avg. minimum temp. (C°) |
Avg. maximum temp. (C°) |
| January | 12 | 22 |
| February | 12 | 22 |
| March | 12 | 22 |
| April | 10 | 19 |
| May | 6 | 18 |
| June | 4 | 14 |
| July | 4 | 14 |
| August | 5 | 15 |
| September | 6 | 17 |
| October | 7 | 18 |
| November | 10 | 20 |
| December | 12 | 22 |
Month |
Avg. minimum temp. (C°) |
Avg. maximum temp. (C°) |
| January | 11 | 22 |
| February | 11 | 23 |
| March | 10 | 21 |
| April | 9 | 18 |
| May | 8 | 15 |
| June | 5 | 13 |
| July | 5 | 13 |
| August | 5 | 14 |
| September | 7 | 13 |
| October | 7 | 17 |
| November | 9 | 19 |
| December | 11 | 20 |
Visit the Bureau of Meteorology for annual, seasonal and monthly summaries of Tasmania's temperatures and rainfall.